1-Click Temperature Graphs using the Raspberry Pi and Dallas
Semiconductor
DS18B20
Brian Mork
© 2022 Increa
Technology
Site Index
• Wiki
• Blog
This paper includes several sections, listed below. The indented
steps are about the remote access options. If you only want to
use the Pi with a local keyboard, video, and mouse (KVM), you can do
just the four sections that are not indented.
Introduction
Remote Access Software
SSH Server on Pi
SSH Client on Windows
Password-less SSH
VNC Server on Pi
UltraVNC on Windows
Xming on Windows
Connect Sensor and Install Kernel I/O Module
Collect Data
Plot Data on Pi KVM
Plot Data Remote Desktop via VNC
Plot Data XServer on Windows
Plot Data after Transfer to Spreadsheet
Introduction
It’s
been a while. Twenty-one years ago
in the Spring of 2001, I collected performance data to see how a wood
burning
stove was heating my house and shed during the winters I was
telecommuting from
home. At the time, I used a C
program and compiler that ran on the Palm Pilot PDA with a data acquisition board.
Now, due to Covid, I am again
telecommuting from
a home office, and wanted a simple way to sit at my work computer,
click on a
desktop shortcut and know if I need to go stoke the wood fire
stoves. The
Linux Raspberry Pi community is pretty good about collecting data with
a
plethora of hardware and software available, and I had one of these $35
computers un-used at the moment. Most of my office work
requires a
Windows application environment for my main OS and desktop. I
wondered if
there was a way to get Linux and Windows playing together.
Standing
on the shoulders of many others, it turned out to be an easy
and fun
project.
This article shows how to use the DS18B20 and a Raspberry Pi to
generate
temperature graphs for monitoring
anywhere your internet connection can reach. The end results is a
Windows 10 desktop shortcut that pops up graphs of data collected with
a networked Linux computer. Because of the modular software
versatility, there are several other ways of viewing the data,
including your smartphone.
The overall architecture is shown in Figure 1. A short python
program
reads raw data from a virtual file (no need to program any I/O events),
calculates temperature, and writes comma separated data to another
file. The shareware program gnuplot is used to generate
plots. This is accessible from a Windows desktop using an
SSH link, reaching across your local area network, or hundreds
of miles away through the internet. Although I used a temperature
sensor, you could use other sensors.
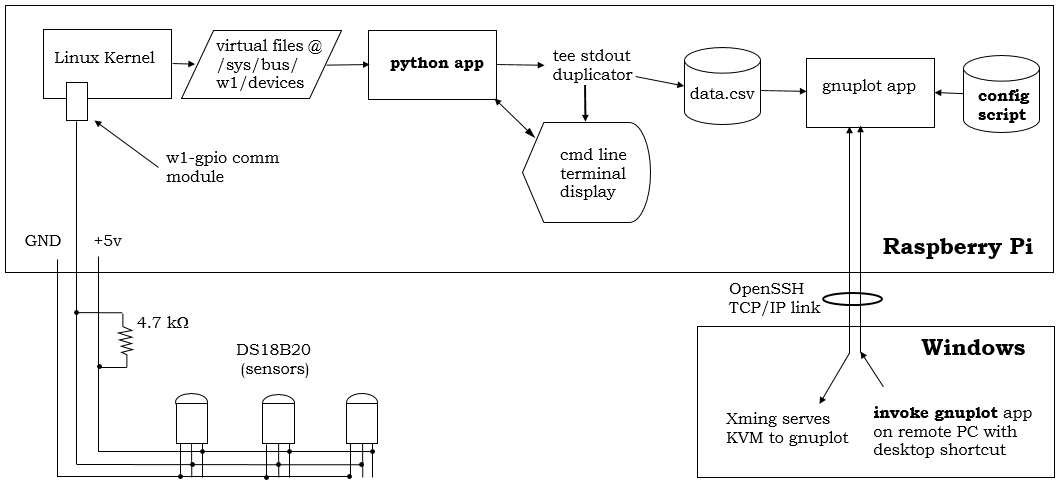
Figure 1 - Any number of DS18B20 could be used, with wiring branched
out from a common distribution board, or daisy-chained from one to the
next.
The temperature sensor for this project is a Dallas Semiconductor DS18B20 (which
is also second-sourced from Maxim). One or more of these can be
used, and because the wire carries only a digital signal, you don't get
any signal degradation even over long distances. On Amazon, lots of 10
sensors can be
had for
about $8, and single item cost is about $1.20. The DS18B20 ranges
-55 to 125 Celsius
(-67 to
257 Fahrenheit), with 9 to 12-bit default resolution (0.1 to 0.0625
Celsius).
Accuracy is ± 0.5 Celsius.
For lowest cost, you can use the sensor(s), a resistor, and your own wire
assembly. Or you can buy the sensor already mounted or wired up
on small interface circuits:
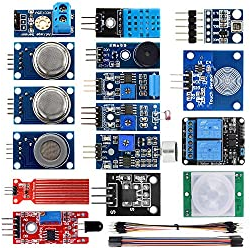
Figure 2 - Sensors available in the Kookye kit. The DS18B20 board is at the bottom of the middle column.
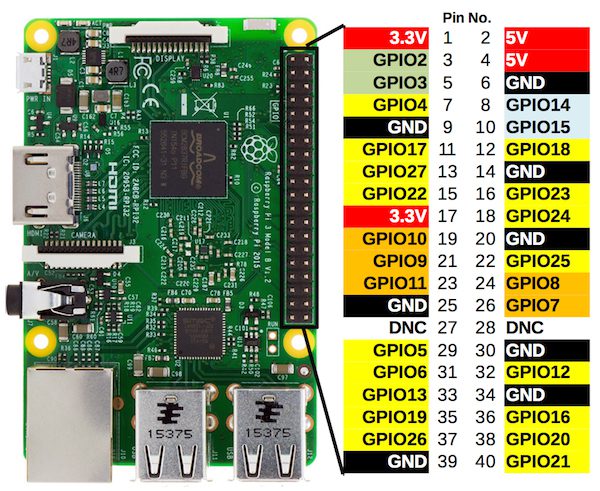
For the computer, I used a Raspberry
Pi 4
model with 40-pin general purpose I/O (GPIO) header. There is
little threat to damaging the GPIO circuits because only a digital
signal is connected, powered by the Pi itself. Older or lower
performance models
of the Pi, including the $10 Pi
Zero W
could be used. Only 3 wires are used (Ground, Power, and GPIO4) in the
base design. With the "1-Wire" interface to the temperature
sensor, a
design could be done without a power wire if slightly degraded
performance
specs would be sufficient; see the sensor datasheet for details.
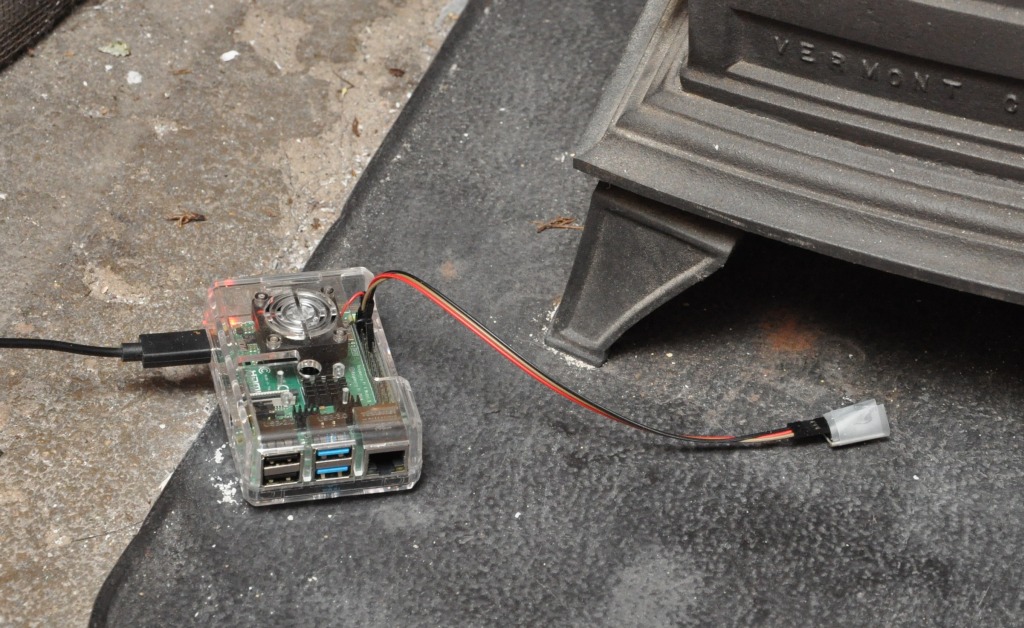
Figure 3 - Data collection system in place to collect wood-fired stove temperatures.
Remote Access Software
A lot of information is on the web about installing and using the
disparate software programs I strung together to make the complete
system. My
hope is that you can see how they work together and use some of the
ideas. I'll run through brief crib notes
getting the various software set up, and please feel free to consult the web for other perspectives or methods.
If you don't have a Pi up and running, I would recommend using the Raspberry Pi Imager
to create and boot a new operating system. Initially, I recommend
using a local keyboard, video monitor and
mouse (KVM) until you get a stable SSH link running. Python comes installed as part of the Raspian OS for
Pi, so you should already have that available to you. Here are
the other software programs used in this project:
- SSH server on the Pi
- VNC on the Pi
- SSH client on Windows 10
- UltraVNC on Windows 10
- XMing X-server on Windows 10
If you do NOT wish to view your data remotely - if you will
collect it and view it using only the KVM of the Pi, you may skip these
five software configurations and jump directly to hooking up wires.
SSH Server on Pi
The newer Raspberry Pi Imager
allows you to specify to run SSH when the OS is installed. However, if SSH
server was not configured to run upon installation of the Raspbian Pi
operating system, you can install it using these commands. On the
Pi, open a terminal command-line window and run
raspi-config
Choose "3. Interface Options", then enable SSH and exit the config
program. If you use a non-standard SSH port (something other than
Port 22) set that in the /etc/ssh/sshd_config configuration file, and
there may be other options you wish to modify.
Reboot the Pi computer, which should start SSH. You
can confirm whether sshd is running with the
command:
systemctl status ssh
VNC Server on Pi
In a Pi command-line window run
raspi-config
Choose "3. Interface Options" and enable VNC. Reboot the Pi computer
and the VNC server should run. You can confirm with the command
ps -ef |grep vnc
Modify the Pi VNC server configuration using the "hamburger meanu" icon along the top of the Pi desktop to
choose
Options. Select authentication with a VNC password, and set the
password on the Users & Permissions page. Check the
Connection option and note the port number - probably 5900. Choose
other options as you desire.
SSH Client on Windows
Newer version of Windows come with SSH client installed.
On Windows 10, try opening a command line window and enter this command, substituting
in any port you specified in the Pi computer file /etc/ssh/sshd_config, and the IP address
of your Pi computer.
ssh -p22 pi@192.168.44.33
You should be queried for the "pi" user password, and then obtain a
Linux command line.
Password-less SSH
In order to
bring up an SSH link without typing in a
password each time, you’ll need to use certificate keys. If you
don't mind typing in your Pi password each time you access data
remotely, you can skip this section.
To
generate SSH keys, at a Windows 10 command prompt, navigate to
C:\Users\{yourusername}\.ssh, and enter the command
ssh-keygen -b 2048 -t rsa
Two new files will be made in the current directory. You can
use
a different length or type of key,
if you want (read about the -b and -t option). nThe file without
an extension is your private key. The ".pub" file is your private
key. If you want, you can rename both files to include some
memory aid so you
remember what day or what computer created them. Keep the ".pub"
suffix on the public key.
Keys were made on the client computer (Window), and you need to
copy the public key onto the Pi computer by appending the ".pub" key
into the ~/.ssh/authorized_keys
file on the Pi. You could do this with a USB drive transfer if
you want, but there's an easier method to send it over the network if
your password SSH is already working.
In order to receive the public key, first make the required Pi directories and files with the correct
permissions. At the Pi command line, type:
cd ~
mkdir .ssh
cd .ssh
touch authorized_keys
chmod 700 ~/.ssh/
chmod 600 ~/.ssh/authorized_keys
Then, use the
Windows command below, substituting in your information (the id_rsa
filename, port, and IP), to copy the public key from Windows to the
Pi:
type %userprofile%\.ssh\id_rsa.pub | ssh -p22 pi@192.168.44.33 "cat >>.ssh/authorized_keys"
Check the authorized_keys file on the Pi and make sure the id_rsa.pub file
was appended into the file.
cat ~/.ssh/authorized_keys
Stop and restart the SSH server on the
Pi.
sudo systemctl restart ssh
systemctl status ssh
Open a Windows command line window and try opening an SSH link, and this time the Pi server should not
ask you for a password. Once the certificate login is working, if
you want to disable password login to your Pi computer SSH server, go back and edit the /etc/ssh/sshd_config file on the Pi and change two lines to read:
PasswordAuthentication no
ChallengeResponseAuthentication no
UltraVNC Viewer on Windows
Download a copy of UltraVNC for Windows, and install.
When you run UltraVNC (click on the desktop icon), specify your Pi as
the server
192.168.44.33::5900
and substitute whatever port number the Pi VNC server showed in the
Connection options menu. Enter the password you configured into
the Pi VNC and you should see the Pi desktop open in a window.
Xming X-Server on Windows
On Win10, download the Xming X-Server, and install it so Windows KVM can be used by a program running on the
Pi. Choose the option to create a short cut on the desktop. XMing
v6.9.0.31 was released public domain; later versions require a
donation of £10. You can also download the Xming manual. After installing, run Xming with the desktop icon:
Xming.exe :0 -clipboard -multiwindow
and then run SSH again to the Pi, adding the "Y" option to skip X-server authentication:
ssh -Yp22 pi@192.168.44.33
Once at the Pi's SSH command prompt, this time run a program that requires a
GUI, such as xterm. A windows should pop up on your Win10 box. If you want, install the Geany editor
on your Pi and try to run it over the SSH link, which offers most of an Integrated Development Environment (IDE) through the SSH
link.
Setup Hardware and Kernel Module
With power REMOVED from the Pi computer, connect the DS18B20
temperature sensor to the Pi general purpose header
with
3 wires. In the TO-92 sensor package version of the DS18B20, Pin
1 is
ground, Pin 2 is data, and Pin 3 is +5v power. The table below
also lists the Kookye interface board I used.
If you are not using an interface board, install an
approximately 4.7 Kohm pull-up resister between Data and Power.
Instead of the 4.7 Kohm, the Kookye board includes a 1Kohm resister in
series
with an LED so it
blinks whenever the data line is pulled low.
Wiring Instructions
DS18B20 Pin
without interface board
|
Pi 40-pin
GPIO Header Pin
| Kookye Interface
Board Header Pin
|
1 GND
|
GND (pin 6,
9, ...)
| "-" |
2 Data
|
GPIO4 (pin 7)
| "S" |
3 VDD
|
+5V (pin 2
or 4)
| middle |
If you choose, you can parallel wire multiple sensors and they will each
be accessible to the python program. A Linux kernel module does all the
I/O operations. On the Pi, each sensor shows
up as its own numbered
directory inside the /sys/bus/w1/devices directory. Inside the
numbered directories, various virtual files provide the data from that
sensor: name, power status, alarms, temperatures, etc.
Install the Pi kernel module to use the 1-wire
communication protocol used by the temperature sensors. On the Pi, edit
/boot/config.txt to include the line
dtoverlay=w1-gpio
Reboot the Pi computer, and when it reboots, ensure the temperature sensor
is communicating with the Linux kernel. Use the
command
lsmod
to confirm if modules are present to read the sensor data. Look down the list for the
line entires
"w1-gpio" and "wire". If you don't see these two line entries,
force the issue with the two commands
sudo
modprobe w1-gpio
sudo modprobe w1-therm
You can now see the device data at /sys/bus/w1/devices. Each
temperature sensor will have a different directory name starting with
"28-xxxxxxxxxxxx". Look in the numbered directory to see all the
information available. Type out the "temperature" file to see the
Celsius temperature (divide the number you see by 1000). To get a
bit more extensive data, we'll use the data in the w1_slave virtual
file.
Collect the Data
Save the following python program into a file "DS18B20temp.py". I
like to use the Geany editor,
which also does syntax highlighting and
compiling to check errors and offers a command line window.
It also offers a built-in command line
tab so everything fits nicely into one SSH session.
import os
import glob
import time
import datetime
import sys
os.system('modprobe w1-gpio')
os.system('modprobe w1-therm')
base_dir = '/sys/bus/w1/devices/'
device_folder =
glob.glob(base_dir + '28*')[0]
device_file = device_folder +
'/w1_slave'
def read_temp_raw():
f =
open(device_file, 'r')
lines =
f.readlines()
f.close()
return lines
# example data we'll be processing
# pi@rasp4:/sys/bus/w1/devices/28-3c01a816f0b9 $ cat w1_slave
# 99 00 55 05 7f a5 81 66 1a :
crc=1a YES
# 99 00 55 05 7f a5 81 66 1a
t=9562
def read_temp():
lines =
read_temp_raw()
while
lines[0].strip()[-3:] != 'YES':
time.sleep(0.2)
lines = read_temp_raw()
equals_pos =
lines[1].find('t=')
if equals_pos
!= -1:
temp_string = lines[1][equals_pos+2:]
temp_c = float(temp_string) / 1000.0
temp_f = temp_c * 9.0 / 5.0 + 32.0
#
return temp_c, temp_f
return temp_f
print('"DateTime","TempF"')
while True:
now =
datetime.datetime.now()
#print(' C
=%3.3f F = %3.3f'% read_temp())
print('"'+str(now)+'","%3.3f"'% read_temp())
sys.stdout.flush()
time.sleep(30)
I'm still
experimenting with the column labels in the first row of the data file. Gnuplot
doesn't seem to care if they're there or not (at least as currently
scripted).
Run this program using the command below (use your own chosen
filenames). If you want the program to read the temperature at a
different rate, change the time.sleep(30) command to however many
seconds you want between readings.
python
DS18B20temp.py | tee -a templog.csv
or, if you compiled the source code with the Geany editor (or any other
way)
python
DS18B20temp.pyc | tee -a templog.csv
The program reads the psuedo-data files created by the Linux
kernel and writes a CSV-formatted temperature data to stdout. Although
all sensors are available to the program via the folder name globbing
statement, only the 1st (index [0]) is used to f.readlines data. The
temperature data goes to the console
screen, and tees to append data to the csv
file (skip the "-a" option if you want to replace prior data files).
You can run through an SSH link for testing, but if you're
going to let the program run for hours, I
would recommend running the command line window natively on the Pi
using VNC or a KVM plugged directly into the
Pi. That way, if the network link dies (or you simply turn
off your laptop computer), the data collection window will remain
alive on the Pi.
So long as the python program is still running on the Pi, stdout
data will be collected into the csv file. To start/stop the
python program, I use VNC to access the command-line window on the Pi
desktop. If you want to start a new log file, just stop the
program, rename or delete the existing file, and the tee command will
start a new file when you run the python command again.
Plot the Data
A graph of the data can be viewed at least four ways:
- Directly on the Pi computer with a local KVM.
- Duplicate the entire Pi desktop on a remote computer using VNC
- Using X-server, run the gnuplot program on the Pi, but use KVM of a remote PC
- Copy data to a remote PC and use separate spreadsheet tools.
1. KVM directly on the Pi computer
Data graphs can be
generated from the command line of your Pi. Install the gnuplot
package, if you don't already have it. Create the following gnuplot script file; I used the
name example.gnuplot.
#
usage:
# gnuplot -p example.gnuplot
set datafile separator ','
set xdata time
set timefmt "%Y-%m-%d %H:%M:%S"
set format x "%H:%M"
set ylabel "Farenheit"
set xlabel "Time"
set style line 100 lt 1 lc rgb
"grey" lw 0.5
set grid ls 100
set style line 101 lw 3 lt 1 lc rgb "#f62aa0"
#set xrange ['2022-02-21 10:00:00':'2022-02-21 11:00:00']
plot "~/Documents/kookye-sensors/templog.csv" using 1:2 with lines ls
101
Using a KVM directly on the Pi, open a command-line window and run the command:
gnuplot -p
example.gnuplot
In a few seconds, you'll see a window open up and show the
data plotted.
Research other gnuplot
options to make it more suitable to your needs.
2. Remotely Access the Pi Desktop with VNC
Instead of using a normal KVM plugged into the Pi, you can use VNC to
remotely open a Pi command-line window and run the
plot command and view the results. This works for any computer
with a VNC client application. Figure 4 is a screenshot of my
smartphone viewing the data with a VNC client app on a
smartphone. Because smartphone keypads are awkward, it might be a
good idea to create a linux script with a short name such as
"doplot.sh", or even "dp".
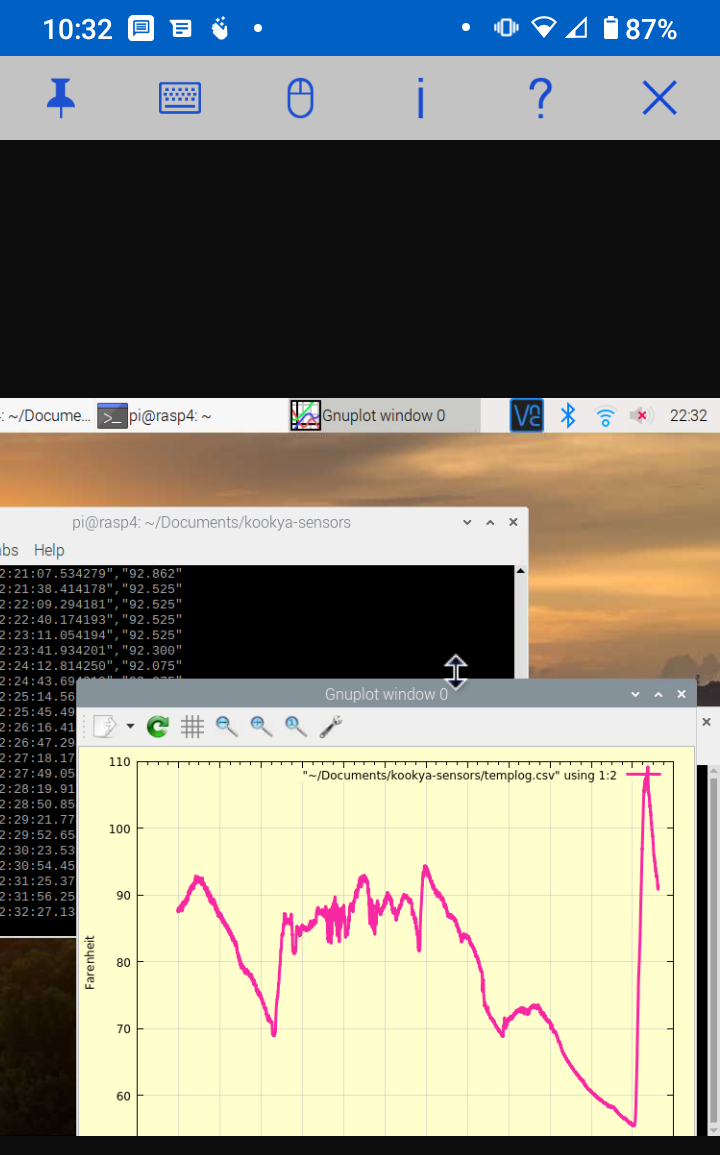
Figure 4 - Smartphone VNC viewer used to run the plot command and view data charts.
3. View X-Server Graph Windows on Windows 10
Using VNC to fully reproduce the video screen and keyboard interaction
is sometimes slow and unresponsive. Displaying just the graph
window through an SSH link often gives better performance. To do this, be sure to run Xming first so the Windows computer
you're sitting at properly serves its screen for gnuplot to use. Use a desktop icon on the Win10 desktop that runs Xming:
"C:\Program
Files (x86)\Xming\Xming.exe" :0 -clipboard -multiwindow
After running Xming, use a second desktop shortcut that creates the
SSH link, runs gnuplot on the Pi computer, and displays the output at
your
Win10 computer. Specify the
following
in the shortcut target field. As always, substitute in your
username, IP address, and gnuplot scriptfile name. The syntax
here assumes the example.gnuplot scriptfile is in your Pi home
directory, but
you could include a full path to an alternate location if you want.
C:\Windows\System32\cmd.exe
/c set "DISPLAY=localhost:0" && start ssh -Y pi@192.68.33.44
gnuplot -p example.gnuplot
When done this way, the X-window
frame and menu options are visible on the Win10 desktop by clicking on a single desktop icon! See Figure 5.
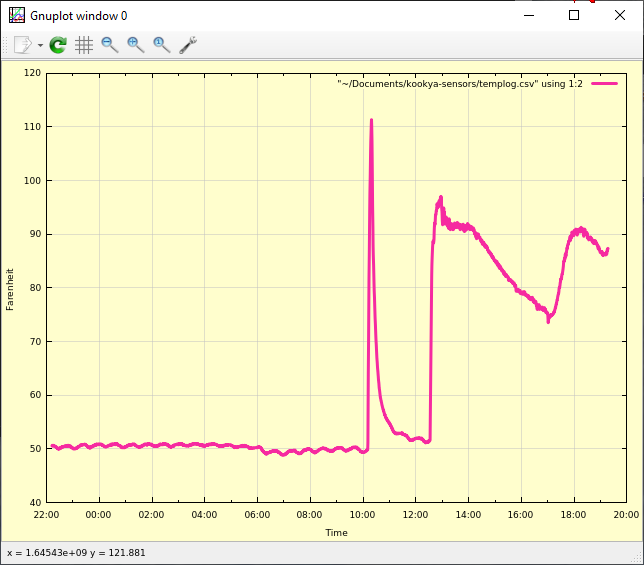
Figure 5 - Use SSH to remotely run the gnuplot command and a graph pops
open on the windows desktop. It comes with Print and Save menus,
too!
Using the menu at the top of the X-window, you can print or save
in various formats (bmp pdf png svg).
Figure 6 shows an overnight heating stove using the .png save
option, typically best for web pages. The .bmp format offers the
best quality, .pdf seems the easy to read with small file size, and
.svg vector format is best for situations where zoom/scaling may be
required.
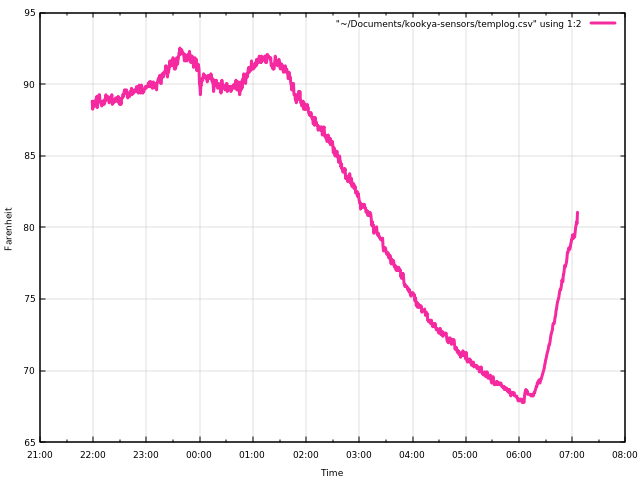
Figure 6 - Showing a png plot. Also available in bmp, pdf, or svg formats.
4. Copy Your Data to a Different Computer
If you want to copy the data log file to your
Win10 box to plot or analyze with a spreadsheet program, you don't have
to stop data collection first. Just run this command in a Win10
command-line
window. Substitute in your LAN IP address and your
directories.
scp
-P22 pi@192.168.33.44:Documents\kookye-sensors\templog.csv destination.csv
Browse to the destination.csv file.
Double click to open in Excel. Highlight
Colums A and B, and use the menu icons to insert a scatter graph. Adjust as
desired. If you want to see the time column differently,
highlight the time column, and format the the visual display of
the cells. If you click on any one cell, you can seed the actual
and entire time/day in that cell.
Conclusion
With this project complete, I can sit at my work desk computer and
every 1/2 hour or so simply click on a desktop shortcut to see a
heating stove chart and determine when I
should go add more wood. If I open an SSH port or VNC port
forward through my router, I can view the data from any internet
location. With just a few solder connections and
building on software applications already created by others, I ended up
with a very capable and versatile design. It's modular enough to
use certain pieces of the architecture for your own project. What
is your favorite reason to monitor
temperature or other sensors?
Feedback, comments, and kudos
appreciated!
Bibliography / Additional Resources
- Kookye
instructions
- 4/20/27 version, with more emphasis on the python program.
- Kookye instructions - 6/1/2017 version, with more emphasis on the hardware.
- Kookye
DS18B20 Circuit Module - using an Arduino computer instead of a Pi.
- DS18B20 documentation from Dallas
Semiconductor or Maxim.
- Getting
started with the Pi Zero W.
- Bootstrapping
a Pi Zero W without KVM.
- Howto
Configure Xming on your computer.

The skeleton of this document was originally created using AbiWord
under a Gnome desktop. It was subsequently edited by KompoZer to
become the web page you are reading. Last updated v1.0 February
2022.