Home Heating
Temperature Data Collection and Analysis
Intrepid Creativity (Increa) TMSM
© 2001-2013 by Brian Mork
Site Index
• Wiki
• Blog
In order to gain a better understanding of how I used propane and
wood BTUs, I used my Palm
Pilot Professional, a MELD
data acquisition (freewarepalm) MELD data acquisition (bpesolutions.com) interface and wrote some software programs
using the PocketC
programming language to collect numbers.
Please credit this
web page
as the source for any information you relay to others. You
can
click on any graph to see a full-size version.
Update February 2022 - The
data acquisition system with the Palm Pilot was pretty innovative and
wokred fine at the time. Now, 21 years later, I find myself
taking similar performance data with a modern Raspberry Pi and Windows 10 laptop and smart sensor.
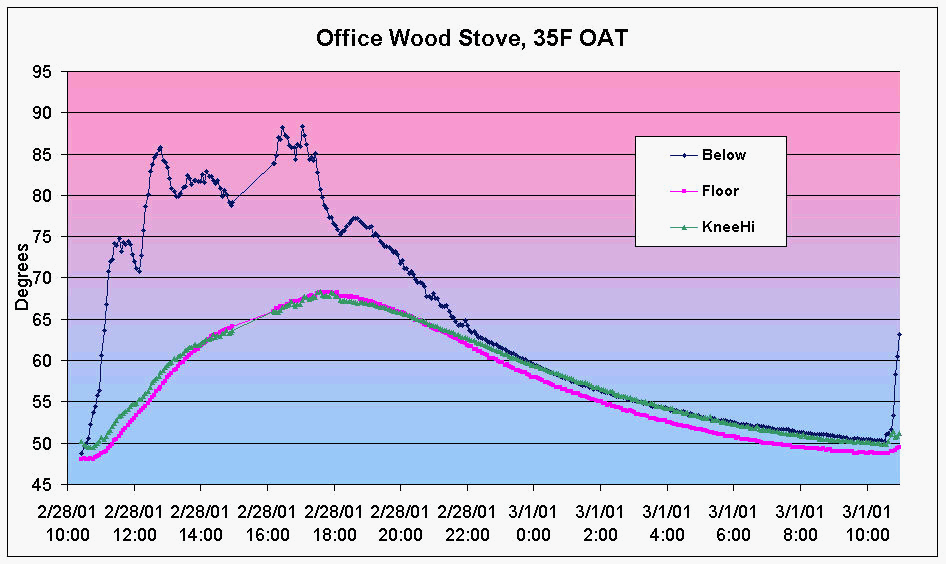 In
order to understand the legend on this graph, you need to understand
how
my home office is set up. It has two stories, with an open
stairway
between them. The wood stove (Jøtul
Model 118) is downstairs. I use a box fan to
circulate the air
from around the stove into the full volume of the room. The
second floor is heated only by convection
up the stairwell, or conduction through the floor.
In
order to understand the legend on this graph, you need to understand
how
my home office is set up. It has two stories, with an open
stairway
between them. The wood stove (Jøtul
Model 118) is downstairs. I use a box fan to
circulate the air
from around the stove into the full volume of the room. The
second floor is heated only by convection
up the stairwell, or conduction through the floor.
Although you can choose to build
your own wood stove, the Jøtul
Model 118 is excellent for log heating, and has a
reflux
air path that forces full combustion to the back of the
chamber. I push coals back as I put in new logs, and then
toward the end of the
day, I pull the coals forward for the last few hours of heat.
Or,
if I want auto-light feature the next morning, I leave the coals
stacked,
and pull them forward the next morning, toss on a few logs, and it
picks
up where it left off the day prior.
I monitored the temperature on the ceiling of the downstairs,
on the
floor of the upstairs, and at sitting height upstairs. You
can see
from the upper trace the six times I added wood or opened the damper.
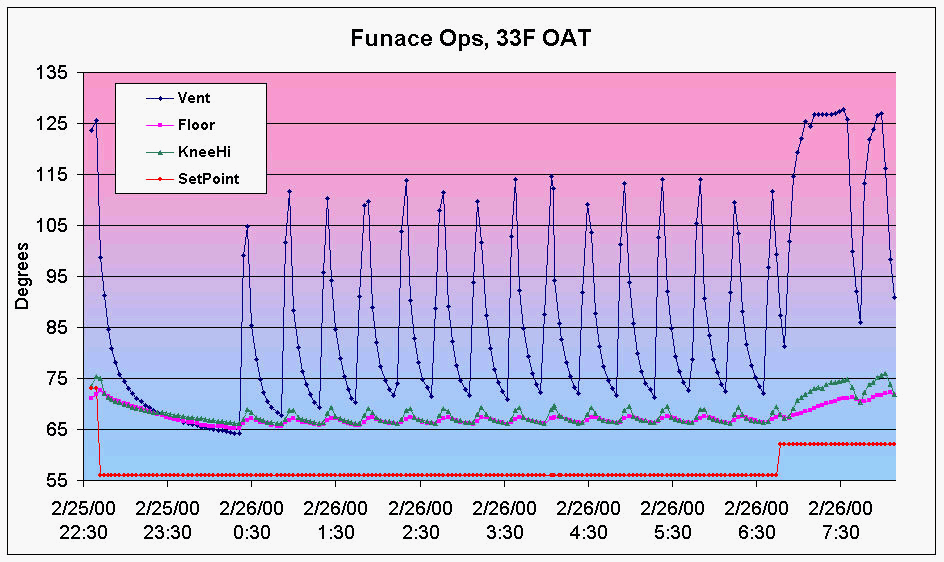 The second graph shows the
propane furnace heating my house. First off,
notice
the disparity between the setpoint (red line) and the three measured
temperatures.
I'm not sure the sensors were accurate, and it's best to consider
relative
movement rather than actual temperature numbers.
The second graph shows the
propane furnace heating my house. First off,
notice
the disparity between the setpoint (red line) and the three measured
temperatures.
I'm not sure the sensors were accurate, and it's best to consider
relative
movement rather than actual temperature numbers.
One temperature sensor was stuffed into the forced air vent,
and two
others monitored the room temperature on the floor, and about 2' above
the floor.
I turned the thermostat up, hooked up the monitoring
equipment, then
turned the thermostat down for the night. The furnace came on
about
13 times during the six hours of uninterrupted night
equilibrium.
Notice when I turned up the thermostat at about 6:45am (red line bumps
up) the burn time
of
the furnace was much longer (width of blue hump). By measuring
the width of each
blue
peak to determine "on-time" of the furnace, I could calculate how many
BTUs I was putting into the house, and back calculate the effective R
value
of the surface area of my house. This calculation was
actually done
for the data coming up next.
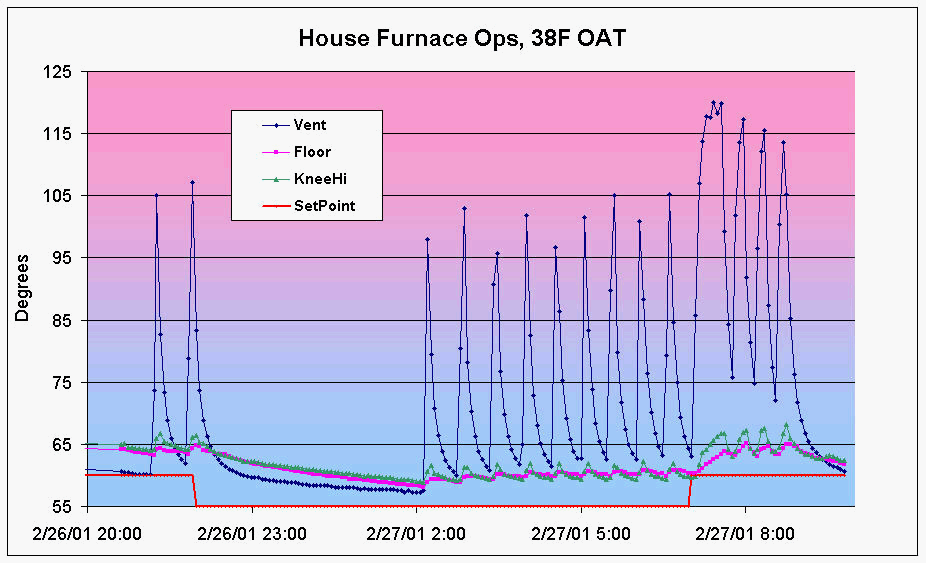 This
graph is similar to the previous one, but shows a more
dramatic effect
of turning down the thermostat at night. This time, I let the
heating
system reach equilibrium before lowering the thermostat. The
result
of a 5 degree lowering of the setpoint was more than 4 hours
of no furnace
activity. That's roughly half my night time heating
cost, or
1/4 to 1/6 of the total heating cost for the day. 16 to 25%
savings for 5 degrees overnight!
Think about this as you read the numbers from my page giving all the numerical
comparisons of fuel sources. You can make a HUGE
dent in heating
costs by simply changing how you use your present heating
system.
Be sure to consider your assumptions of comfort and convenience while
you
pursue less expensive fuel.
This
graph is similar to the previous one, but shows a more
dramatic effect
of turning down the thermostat at night. This time, I let the
heating
system reach equilibrium before lowering the thermostat. The
result
of a 5 degree lowering of the setpoint was more than 4 hours
of no furnace
activity. That's roughly half my night time heating
cost, or
1/4 to 1/6 of the total heating cost for the day. 16 to 25%
savings for 5 degrees overnight!
Think about this as you read the numbers from my page giving all the numerical
comparisons of fuel sources. You can make a HUGE
dent in heating
costs by simply changing how you use your present heating
system.
Be sure to consider your assumptions of comfort and convenience while
you
pursue less expensive fuel.
I hoped to take the longer temperature decay time of this
graph an use
it to graphically determine the Whole-wall R-value of my
house. R
is the inverse of U, which has units of BTU / (sqft * hr *
degF).
In other words, U expresses how much energy passes through a square
foot
of the house in an hour for every degree Fahrenheit difference in
temperature.
In order to estimate these values for my house, I can see how much
energy is spent to keep a constant temperature in the house.
After the large temperature decay, the furnace starts cycling
on and
off. It comes on for about 4 minutes every 40 minutes or
so. Adding up the peaks indicates it spends 36 minutes of time
kicking out 74,000 BTU/hr during
3hr:52min of monitored activity. That's 44,400 BTU over the
course
of 3.9 hours. Toss in the fact that my house has 4360 square
feet
of surface area (walls, ceiling, and floor), and the 29 degree
temperature
spread, and you get:
R = 4360 * 3.9 * 29 / 44400 = 11
Normally, what you get quoted in the store as you plunk down
the big
dollars for rolls of pink stuff is the Center-of-Cavity
R-value.
What you experience in a real house is the Whole-wall
R-value, which allows for door drafts, window sill
conduction, and
other non-ideal behavior. I think R-11 isn't that bad, but
I'm interested
in results from others who repeat the same experiment.
This page is maintained by Brian Mork, owner &
operator of IncreaTMSM
// It was last modified February 2022. Suggestions for changes and
comments are always welcome. The easiest way is to contact me via e-mail.